A deep dive into ownership statistics, purchasing trends, and market share of electric bicycles and tricycles
The electric bicycle industry has experienced explosive growth over the past decade, fundamentally changing how we think about personal transportation. But just how many people actually own e-bikes today? And what does the purchasing landscape look like for these increasingly popular vehicles?
Current E-Bike Ownership Statistics
As of 2024, approximately 4.5 million Americans own electric bicycles, representing a dramatic increase from just 200,000 owners in 2012. This translates to roughly 1.4% of the U.S. population currently owning an e-bike, though this percentage varies significantly by region and demographic.
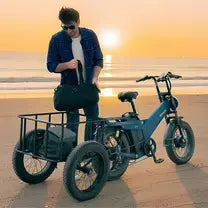
The E-Trike Market Share
Electric tricycles represent a smaller but rapidly growing segment of the market. Current estimates suggest that approximately 680,000 Americans own e-trikes, making up about 15% of total e-bike ownership. This segment has seen particularly strong growth among:
- Adults aged 55+ seeking stable transportation options
- Individuals with mobility challenges
- Commercial delivery services
- Families looking for cargo-carrying capabilities
The e-trike market has grown by an impressive 47% annually over the past three years, significantly outpacing traditional e-bike growth rates.
Online vs. In-Store Purchasing Trends
The purchasing landscape for electric bikes reveals a fascinating split between digital and traditional retail channels:
Online Dominance
62% of e-bike purchases now occur online, representing a significant shift from pre-pandemic patterns when only 34% of sales were digital. This trend has been accelerated by:
- Better online product visualization tools
- Comprehensive customer reviews and ratings
- Competitive pricing and frequent promotions
- Direct-to-consumer brands offering better value
- Improved shipping and assembly services
Local Store Resilience
Despite the online surge, 38% of e-bike sales still happen in physical stores. Local bike shops and specialty retailers maintain their relevance through:
- Hands-on testing and demonstration opportunities
- Professional fitting and customization services
- Immediate availability and instant gratification
- Local service and maintenance support
- Building trust through face-to-face interactions
Interestingly, hybrid purchasing behavior is becoming increasingly common, with 43% of buyers researching online before purchasing in-store, and 28% of online buyers visiting physical locations first.
The Dollar Impact
The financial scope of the e-bike market tells a compelling story of industry transformation:
Market Value
The U.S. e-bike market reached $1.8 billion in 2024, with projections suggesting it will hit $3.2 billion by 2028. The average selling price of e-bikes has stabilized around $1,850, though this varies significantly by category:
-
Entry-level commuter e-bikes: $800-$1,400
-
Mid-range recreational models: $1,500-$2,800
-
Premium and specialty e-bikes: $3,000-$8,000+
-
E-trikes: $1,200-$4,500 (higher due to additional components)
Consumer Spending Patterns
E-bike owners typically spend an additional $340 annually on accessories, maintenance, and upgrades, creating a robust aftermarket ecosystem worth approximately $1.5 billion.
E-Bikes as Percentage of Total Bicycle Sales
Perhaps the most striking statistic in the cycling industry is how rapidly e-bikes have captured market share:
Volume Share
E-bikes now represent 18.5% of all bicycle unit sales in the United States, up from just 3.2% in 2019. This percentage varies dramatically by price segment:
-
Under $500: E-bikes represent 2% of sales
-
$500-$1,000: E-bikes account for 12% of sales
-
$1,000-$2,000: E-bikes make up 45% of sales
-
Over $2,000: E-bikes dominate with 78% of sales
Revenue Share
Even more impressive is e-bikes' share of total bicycle industry revenue: 47.3% of all bicycle dollars spent in 2024 went toward electric models. This outsized revenue impact reflects the higher average selling price of e-bikes compared to traditional bicycles.
Regional Variations
E-bike adoption varies significantly across the United States:
-
West Coast: E-bikes represent 28% of bicycle sales
-
Northeast: 22% market share
-
Mountain States: 19% market share
-
Midwest: 14% market share
-
Southeast: 11% market share
Demographic Insights
Understanding who's buying e-bikes reveals important trends:
Age Distribution
-
25-34 years: 28% of e-bike owners
-
35-44 years: 24% of e-bike owners
-
45-54 years: 22% of e-bike owners
-
55-65 years: 18% of e-bike owners
-
65+ years: 8% of e-bike owners
Income Correlation
E-bike ownership strongly correlates with household income:
-
$75,000+: 67% of e-bike owners
-
$50,000-$75,000: 23% of e-bike owners
-
Under $50,000: 10% of e-bike owners
Future Projections
Industry analysts predict that e-bike ownership will reach 12 million Americans by 2030, representing approximately 3.6% of the population. Several factors support this aggressive growth projection:
-
Infrastructure Investment: $1.2 billion in federal funding for bike infrastructure
-
Corporate Adoption: Increasing employer bike-to-work incentives
-
Urban Planning: Cities prioritizing bike-friendly transportation policies
-
Technology Improvements: Better batteries, lighter weights, and lower costs
-
Environmental Awareness: Growing concern about carbon footprints
The Tipping Point
The data suggests we're approaching a critical tipping point in bicycle transportation. With e-bikes capturing nearly half of all bicycle revenue and showing no signs of slowing growth, they're transitioning from niche product to mainstream transportation solution.
For retailers, manufacturers, and urban planners, these statistics paint a clear picture: the electric bicycle revolution isn't coming—it's already here. The question isn't whether e-bikes will continue to grow, but how quickly they'll reshape our understanding of personal mobility.
As we look toward the future, one thing is certain: the humble bicycle, electrified and reimagined, is pedaling us toward a more sustainable and accessible transportation future.
What's your experience with e-bikes? Have you noticed more electric bicycles in your community? The data suggests you're not alone in considering this growing transportation trend.


Share:
TESWAY X5 PRO Cargo E-Bike – Power, Performance & Cargo Redefined
The Real Cost of Car Ownership vs E-Bikes: 2025 Breakdown